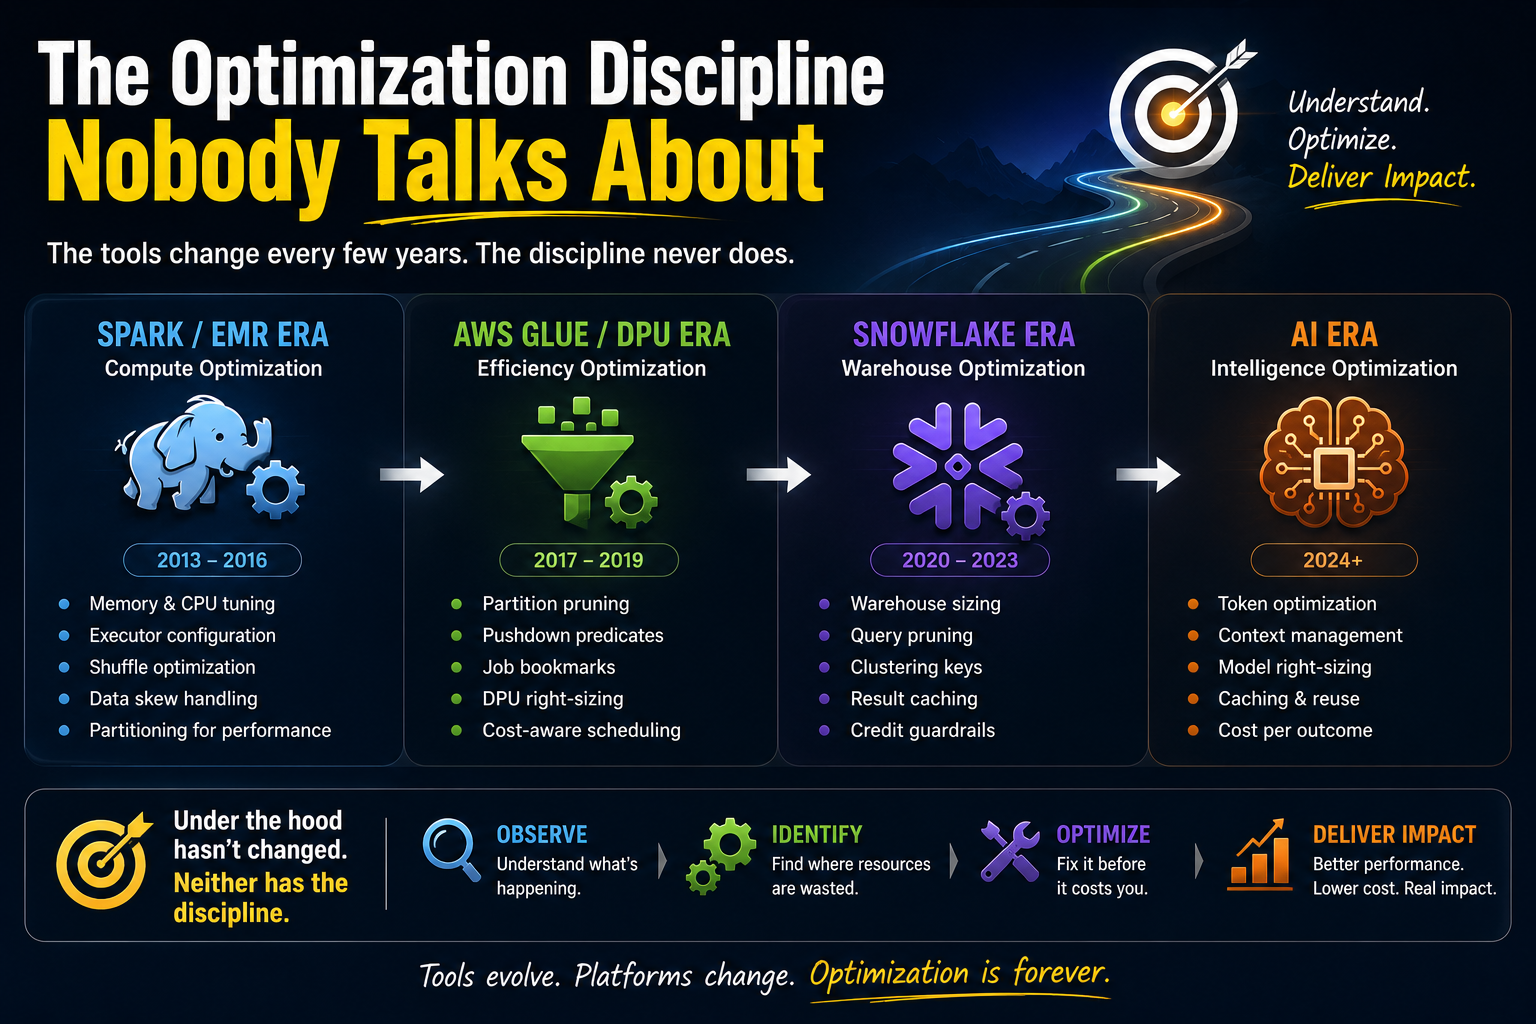
The tools change every few years. The discipline never does.
I've spent 12 years tuning compute across four generations of data tooling — Spark, AWS Glue on EMR, Snowflake, and now watching AI APIs emerge as the next layer. Every time the stack changed, I had to relearn the specific knobs. But the underlying instinct was always the same: understand what's happening underneath the abstraction, find where resources are being wasted, and fix it before it costs you.
Here's what that actually looked like across each era.
Era 1: Spark — From RDDs to DataFrames (Sonos, 2014–2018)
I started with Spark at version 0.9. At that point, everything was RDDs — Resilient Distributed Datasets. You read data as an RDD, transformed it as an RDD, and if you wanted to do anything SQL-like, you converted it manually. It was verbose and low-level, but it was all we had.
Then Spark 2.0 arrived and DataFrames became the entry point. The shift was significant. We had an entire codebase and framework written against the RDD API that needed migrating. But the migration taught us something important: Spark SQL and DataFrame functions behave identically under the hood. The catalyst optimizer doesn't care which surface you used — it compiles both down to the same physical plan.
The most instructive project at Sonos was building the music usage dashboard — users could see their listening history on the Sonos mobile app, aggregated over months, years, and lifetime. We had terabytes of data to process.
The first approach was brute force. I was spinning up 100+ EMR clusters in parallel trying to get the aggregations done. Out of memory errors, no matter how much I scaled. More clusters, same crash. I didn't understand why at the time — I just kept throwing compute at the problem.
I didn't understand why until Meredith.
Era 2: EMR, AWS Glue, and the Data Lake (Time Inc / Meredith, 2018–2021)
I joined Time Inc in 2018 — by the time I walked in the door, the Meredith acquisition had just closed. I encountered managed tooling at scale for the first time — EMR clusters, AWS Glue, Athena, and the full data lake stack. But more importantly, this is where the Spark internals finally clicked.
In 2019 I attended Spark Summit where I sat in on a tuning best practices session that changed how I thought about Spark permanently. That was also the year Delta Lake was introduced. But the session on internals was what stuck.
For the first time I understood how to read the Spark UI properly. How to trace a slow stage back to a skewed partition. How the catalyst optimizer constructs a logical plan and then an optimised physical plan — and critically, how caching can interfere with that process. Caching a DataFrame forces the optimizer to fix the plan at that point. If you cache too early or in the wrong place, you prevent the optimizer from pushing down predicates or pruning columns it would have eliminated later. Cache is a tool, not a default.
Looking back at the Sonos OOM problem with this understanding, the root cause became obvious. The shuffle partition count was wrong for the data volume — Spark was trying to aggregate terabytes of data across too few partitions, causing individual tasks to exceed memory limits. The fix wasn't more clusters. It was repartitioning before writing and bucketing the output so the aggregation work was distributed properly. The answer was always in the data distribution, not the cluster size.
The lesson I carried forward: more compute is the last resort, not the first response.
That same instinct applied directly to the work at Meredith. We were building an enterprise data lake — ingesting CSV files from S3 and writing them out as Parquet, Hive-partitioned, based on how the data science team actually queried the data. Not how we ingested it. Not what was convenient for us. How it would be consumed. This paid off immediately with Athena — partition pruning meant queries scanned only the relevant slices rather than the entire lake.
One Glue job kept failing regardless of how many DPUs we added. We traced it back to a single massive file sitting in one partition. Spark assigned one task to process it — no parallelism, all the work on one executor, which buckled under the memory pressure. The fix: repartition the DataFrame to 200 immediately after reading. The job stabilised. DPU count dropped to 2. The problem was never compute. It was data distribution.
The CCPA deletion framework showed how much partitioning design matters beyond performance. When a deletion request came in, we needed to identify the exact partition containing that user's data, swap only those files, and leave everything else untouched. Pushdown predicates let us pinpoint the right partition instantly. If we hadn't designed the partitioning around queryable identifiers from the start, we would have had to scan the entire data lake for every deletion request. Good partitioning design turned a potentially catastrophic compliance problem into a manageable file swap.
Glue also introduced a different kind of waste — idle compute. Glue was relatively new and had no proper local development environment. The workflow was to spin up a Glue development notebook in AWS, build and test the business logic there, then package it into a framework and deploy. Notebooks required a minimum of 5 DPUs and ran continuously until manually shut down. Some days people forgot. Notebooks stayed up overnight, over weekends.
The fix had to be built: a bash script framework that spun up a notebook on demand and automatically tore it down at 6pm every day. The result was a 70% reduction in Glue development costs. Not from architectural changes — from removing the friction that caused waste.
Idle compute is silent. It doesn't alert you. It just runs.
Era 3: Petabyte Scale (AWS, 2021)
At AWS I worked on a centralised enterprise data warehouse managing 45–50 petabytes. The problems were familiar — just at a scale where the consequences of getting it wrong were immediate.
End-of-month data rollovers regularly caused Spark memory failures. The instinct to scale up the cluster was always there — and sometimes necessary. But the durable fix was always the same: filter before joins, push predicates early, bring only the data you need into memory. At petabyte scale, query hygiene isn't optional. One poorly written query doesn't just slow a job down — it takes down the cluster.
Era 4: Snowflake (Mindera, 2023–Present)
At Mindera we adopted Snowflake across the engineering team. The abstraction is different — no Spark executors, no EMR clusters — but the waste patterns are identical.
We built cost and utilisation dashboards early on, specifically to surface expensive queries and unexpected warehouse usage. That visibility led to a ~50% reduction in critical pipeline runtimes through targeted optimisation.
The most instructive incident happened during a December holiday period. Most of the engineering team was on leave, a code freeze was in place, and a few ad-hoc queries ended up keeping a warehouse running for over 24 hours. Nothing was wrong with the queries themselves. But without execution timeouts and monitoring in place, there was no guardrail to catch unusual compute behaviour.
The fix the following year: execution timeouts per warehouse, alerts for long-running queries, and warehouse categorisation by workload type. ETL warehouses auto-suspend aggressively because queries are sporadic. BI warehouses for Power BI stay slightly warmer because the same queries often run in succession and benefit from the local disk cache. The settings that make sense for one workload actively harm another.
This is Snowflake's version of right-sizing a Spark cluster. The tool changed. The discipline didn't.
What comes next
Every tool in this list got better at hiding its own inefficiency over time.
Spark added adaptive query execution. Glue improved its default partitioning behaviour. Snowflake introduced query acceleration, auto-clustering, and result caching out of the box. The sharp edges that required manual tuning in year one became defaults by year five.
AI APIs are at year one.
Token costs are already dropping. Context windows are getting larger. Caching and routing are becoming first-class features. The tooling will mature — it always does.
But here's the question I keep coming back to: will the engineers building on top of LLMs develop the same optimisation instinct before the tooling bails them out? Or will the abstraction layer move so fast that the discipline never gets internalised?
Every era I've lived through, the engineers who understood the cost model underneath the abstraction were the ones who built systems that held. The ones who trusted the tool to figure it out were the ones who got surprised at the end of the month.
I don't know yet what token optimisation discipline looks like in practice at scale. Nobody does — not really. But I'm fairly confident the instinct that applies is the same one I've been using since 2014.
Understand what's happening underneath. Measure it. Fix it before it becomes an incident.
Supreeth M Gowda has spent 12+ years across data engineering, software engineering, performance engineering, and data science. He now consults through Encore — learn more about him and his services.